Scientists and resource managers rely on the collection of long-term data sets to document environmental and population changes, but what happens when there is a challenge to the collection of the data itself?
Expert groups in ICES Ecosystem Observation Steering Group design, plan, and coordinate monitoring surveys and maintain continuity of critical data series used in science and advice, some of which represent decades of data.
The groups provide guidance to data collectors and data users to help facilitate the cohesion of egg, larval, acoustic, video transects, and trawl surveys conducted across a range of different sites and times. These important datasets are used to monitor the state of ecosystems and to understand how the environment and its occupants are changing over time due to environmental changes and anthropogenic pressures such as fishing.
Technological advancements, climate variability, and unavoidable changes to sampling and support are a few examples of the changes that can alter or disrupt data collection and continuity. The expert groups develop protocols and sampling recommendations so that the changes in sampling regimes can be accommodated while not compromising the value of the long-term dataset.
Here, we take a
closer look at the challenges ICES groups face in maintaining their data sets and the solutions found.
Working Group on Mackerel and Horse Mackerel Egg Surveys
(WGMEGS)
The
international mackerel and horse mackerel egg surveys provide
spawning stock biomass (SSB) estimates for both the Northeast Atlantic mackerel and Southern horse mackerel stocks as well as a relative abundance index of the Western horse mackerel stock in the Northeast Atlantic based on counts on freshly spawned eggs of these species. These timeseries feed into stock assessments for European mackerel and horse mackerel as
fishery-independent information. The data also provide important information on the timing and location of spawning for mackerel and horse mackerel.
During these surveys, plankton samples are collected to quantify the freshly spawned eggs in the water column of the spawning grounds providing egg production measures for both species. For mackerel and southern horse mackerel fecundity samples are also collected to provide a basis for calculating the SSB.
The surveys have been carried out for more than 35 years. They cover a large area from southern Portugal to north of Scotland and operate between January and the end of July to cover the total spawning season for both target species. Germany, Ireland, Netherlands, Scotland, Portugal, Spain (IEO), Spain (AZTI), Iceland, Faroe Islands, Norway, and Denmark are currently involved in the survey.
Since 2007, major changes have been detected in the temporal and spatial distribution of Northeast Atlantic mackerel egg production. Spawning activity has expanded northwestward to waters north of the Faroe Islands and west of Rockall Trough. Peak spawning time has also varied highly between March and May in recent survey years.
Consequently, adequate coverage of the total spawning activity in both space and time has become a challenge for
WGMEGS in recent survey years. The survey planning group has tackled these challenges by recruiting new survey participants from Iceland and the Faroe Islands, as well as by adapting the survey design. Major strategies were the spatial and temporal redistribution of sampling effort as well as changing certain rules for adaptation of transects.
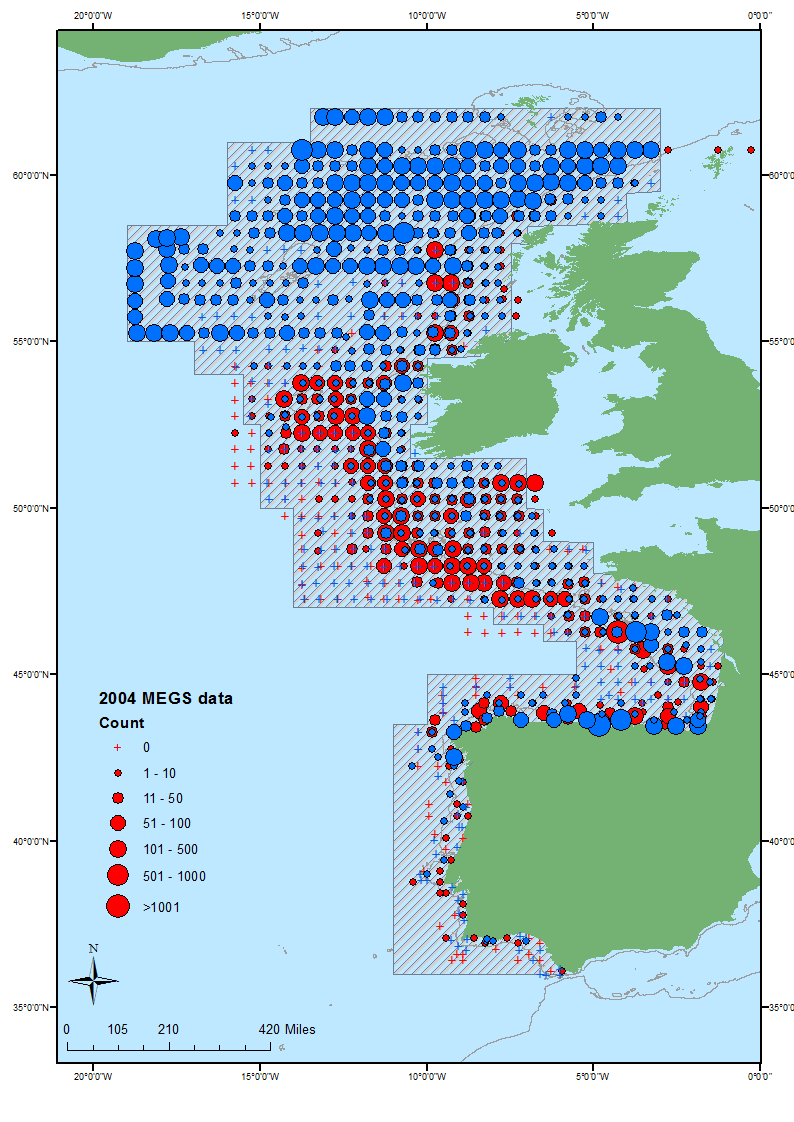
Map showing the increase in egg distribution from 2004 (red bubbles) to 2016 (blue bubbles scaled to the same order of magnitude). In 2016, boundaries in the north and northwest were not delineated despite an increase in survey days since 2004.
Discover the Working Group on Mackerel and Horse Mackerel Egg Surveys.
Working Group on Surveys on Ichthyoplankton in the North Sea and adjacent Seas (WGSINS)
The
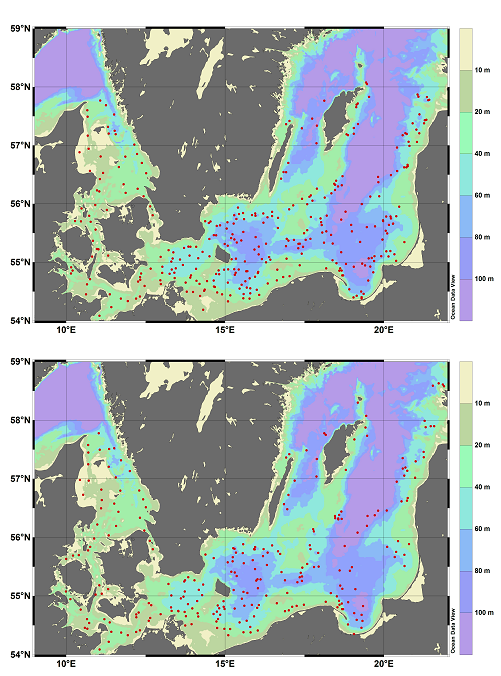
international herring larvae surveys in the North Sea and adjacent waters (IHLS) began as an ICES coordinated survey in 1972. The surveys monitor the main spawning grounds of North Sea herring. In autumn, this comprises the northern stock components, for example Orkney−Shetlands, Buchan, and Banks and in winter, the southern component in the English Channel, for example Downs. The focus of the surveys are newly hatched herring larvae caught by plankton nets. Their variable annual abundance gives information on the dynamics of spawning stock size of herring.
Most nations surrounding the North Sea participated in the IHLS but at the end of the 1980s things changed. Developments in hydro-acoustic technologies saw several countries shift their survey efforts into acoustics and participation in the IHLS dropped sharply. Since 1994, only two countries have continued the IHLS in the North Sea (Germany and the Netherlands). The remaining ship time was not sufficient to cover all areas and time windows formerly monitored, and those estimates which rely on a full temporal and spatial coverage of the spawning habitats, like larvae production estimates, could no longer be calculated.
However, the Planning Group for Herring Surveys (PGHERS) and
Herring Assessment Working Group (HAWG) still thought the IHLS delivered valuable information to the assessment. The remaining participants combined their efforts to cover as many areas as possible. In principle, each of the northern spawning grounds should be sampled at least once a year. For the Downs component in the English Channel, it was possible to maintain the survey effort on the same level as formerly done, i.e. three surveys per spawning season. Statistical models were incorporated to mimic and bridge uncovered survey areas in the larvae abundance index (LAI). In doing so, large parts of the time-series were maintained, the assessment was provided with a tuning series from the larvae surveys, and the stock components dynamics and their relative contribution to the overall estimate were monitored.
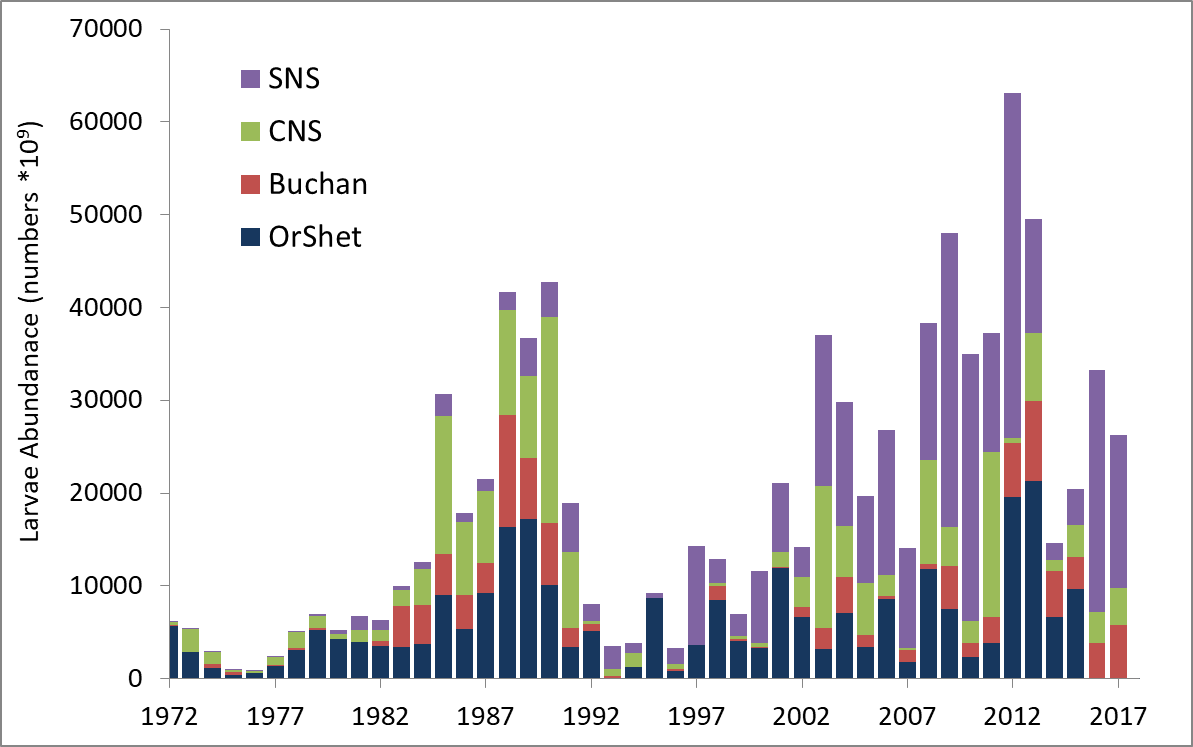
Herring larvae abundance on the main spawning grounds in the North Sea as observed since 1972. The coloured bars indicate the annual contribution of the specific spawning stock component to the overall estimate. Please note not all areas were covered each year. There was no sampling in the Orkney-Shetlands in 2016 and 2017.
Discover the
Working Group on Surveys on Ichthyoplankton in the North Sea and adjacent Seas.
Working Group on Surveys on Ichthyoplankton in the North Sea and adjacent Seas (WGSINS)
The main targets of the
Midwater Ringnet Survey (MIK) are foraging herring larvae. MIK net sampling has been carried out during the first quarter of the International Bottom Trawl Survey (IBTS) in the North Sea since 1977. The large 2-metre ringnet is deployed at nighttime to prohibit gear avoidance by the herring larvae. Sampling is carried out on ICES rectangle basis, and at least four trawls per rectangle should be carried out.
The MIK index (IBTS0) provides important recruitment information for the North Sea herring assessment. However, the ringnet catches contain a mixture of northern and southern herring stock components. Larvae standard length is used to separate between them. Historically, larvae < 20 mm standard length were considered as Downs larvae. The index represents recruitment of the northern components only and stations south of 54° N with Downs larvae present are excluded from the index calculation.
Downs larvae hatch in December and January, and by the time the MIK survey takes place (mainly in February),they haven't necessarily passed the phase of mass mortality that typically occurs in the early life stages of fish. Because of this, they bias the recruitment signal when included in the index.
Looking at the history of the MIK time-series, it is not always clear how the rule of exclusion was followed. There were some exceptions to the rule but why these were introduced has not been well documented. Recent years has also seen increasing amounts of Downs larvae drift further north than previously observed (for example into the Skagerrak). As the exclusion rule only takes effect south of 54° N, the calculation of the index resulted in an overestimation of recruitment for the northern component. The calculation procedure was re-examined as researchers sought a transparent, fully documented, and practicable way of index estimation.
It happened that discriminating between components best occurred at 18 mm standard length and, perhaps more influential, only the amount of larvae in that size range should be excluded per station, but not all larvae of the station as a whole. Using this new approach, the time-series was re-calculated back to 1992 and is now regarded as a more objective and reproducible data product.
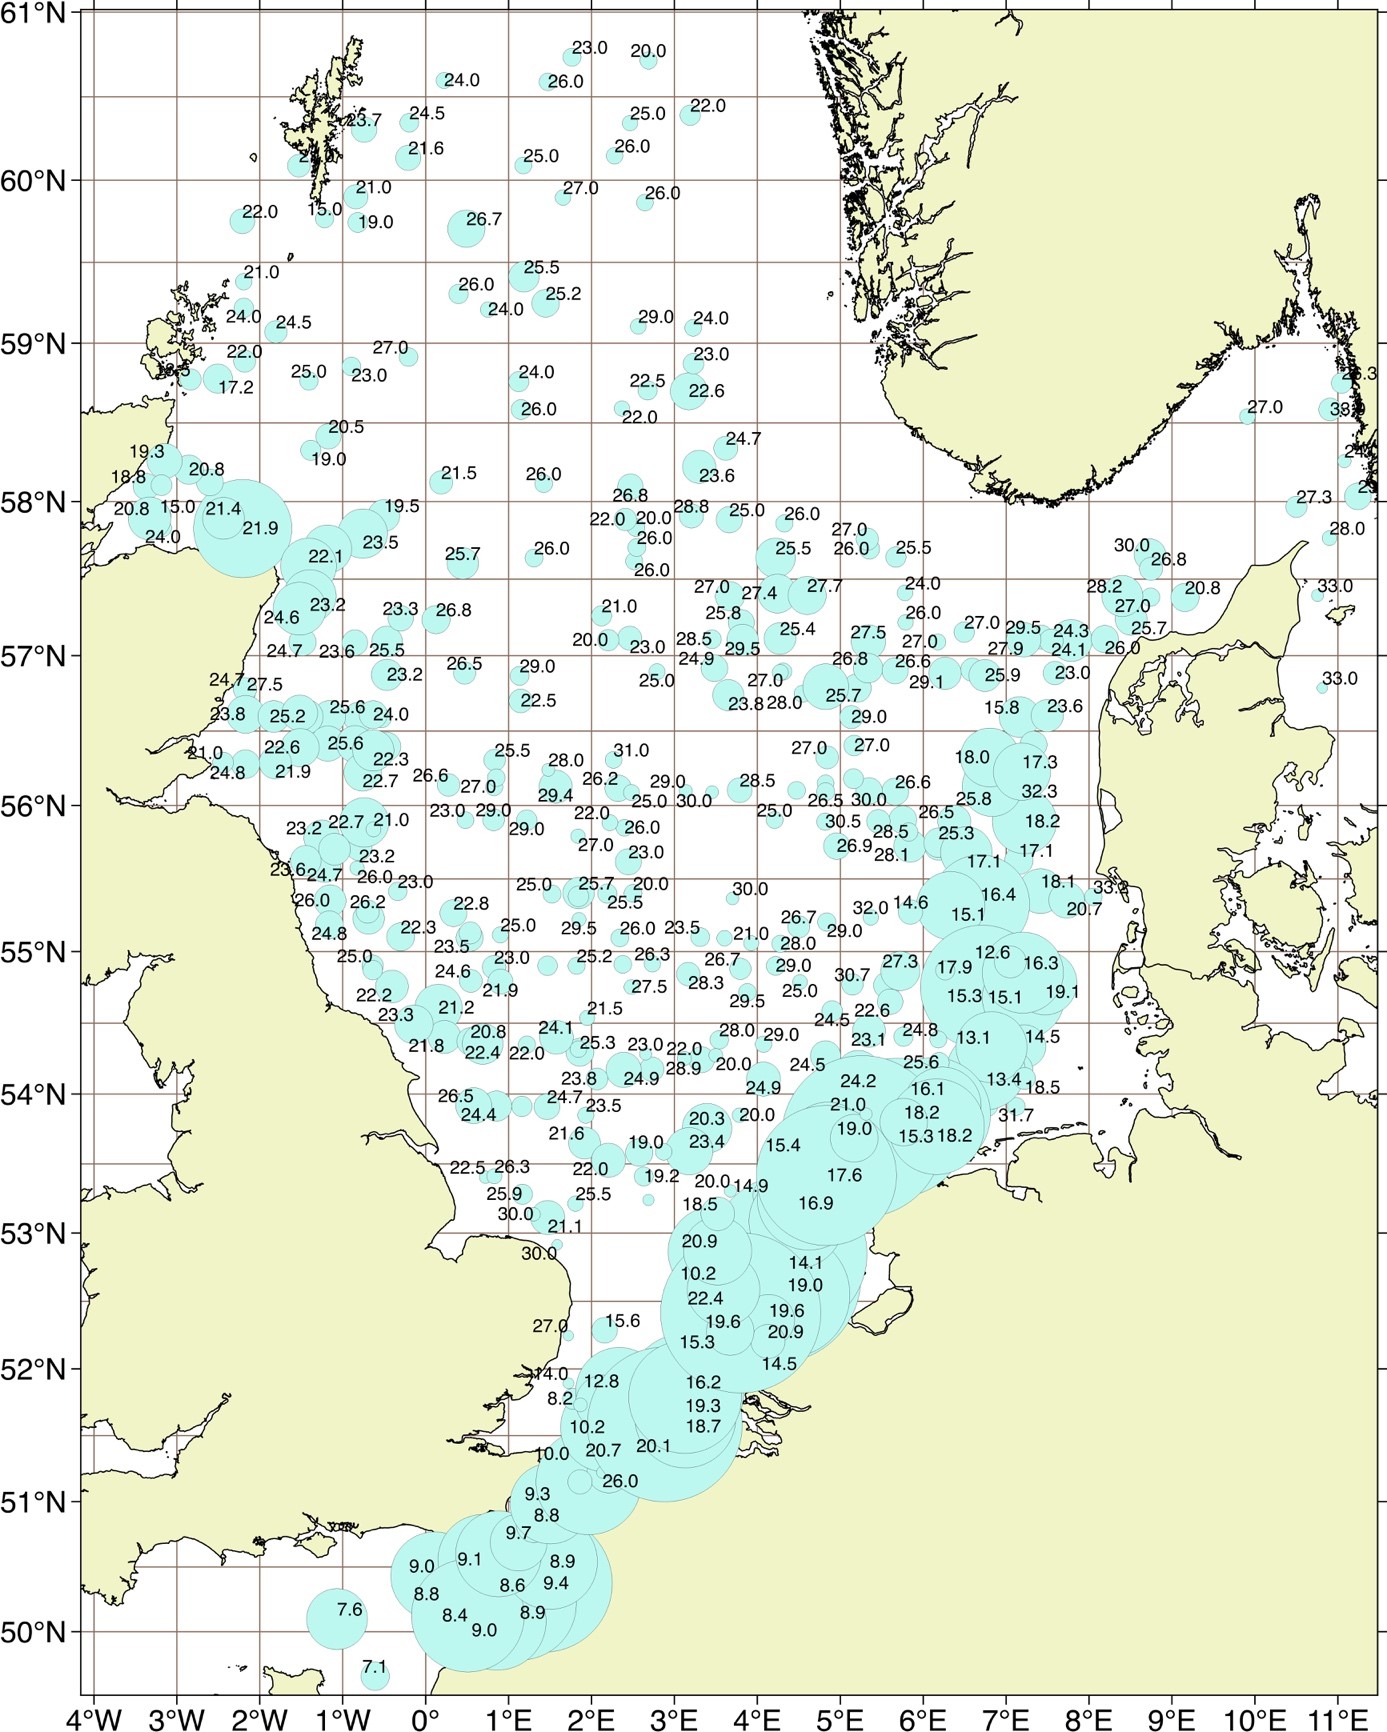
The distribution of herring larvae per station during the 2016 MIK/IBTS survey in January/February. The diameter of each circle corresponds to the square root transformed abundance (n/m2) of the total herring larvae per station. The largest circle represents a larval abundance of 46.2 larvae per m2. The numbers represent the mean herring larvae length per each station. Note the high abundances of small larvae (mean length < 20 mm SL) in the eastern part of the North Sea and north of 54°N.
Discover the Working Group on Surveys on Ichthyoplankton in the North Sea and adjacent Seas.
Working Group on Acoustic and Egg Surveys for Sardine and Anchovy (WGACEGG)
WGACEGG coordinates the
pelagic integrated surveys in ICES areas 7, 8, and 9. Since the 1980s, these surveys have provided
fisheries-independent, acoustic, and egg-based (DEPM and CUFES) long-term datasets on the biomass, demographic structure, and reproductive parameters of sardine and anchovy populations.
Survey biomass estimates are the main inputs used to manage those commercially important small pelagic stocks in the Northeast Atlantic. Taking advantage of the fine spatial resolution of acoustic and egg data and the secondary ecosystem data provided by integrated pelagic surveys, WGACEGG since 2003 has also compiled standard gridded maps of anchovy and sardine eggs and adult's biomass, as well as maps of key
in-situ hydrological parameters (surface salinity and temperature). These long-term, spatially explicit datasets provide complementary information on fish distribution and habitats, useful for ecological studies, ecosystem-based fisheries management, and spatial planning.
WGACEGG has faced several challenges to maintain the continuity of those long-term datasets. Methods for acoustic and DEPM data collection and analyses have been standardized, reviewed, and improved by the group. Vessel intercalibrations have been conducted under the auspices of the group to ensure series consistency. Long term partial funding of sea surveys has been secured through the European Union's Data Collection Framework which informs the Common Fisheries Policy.
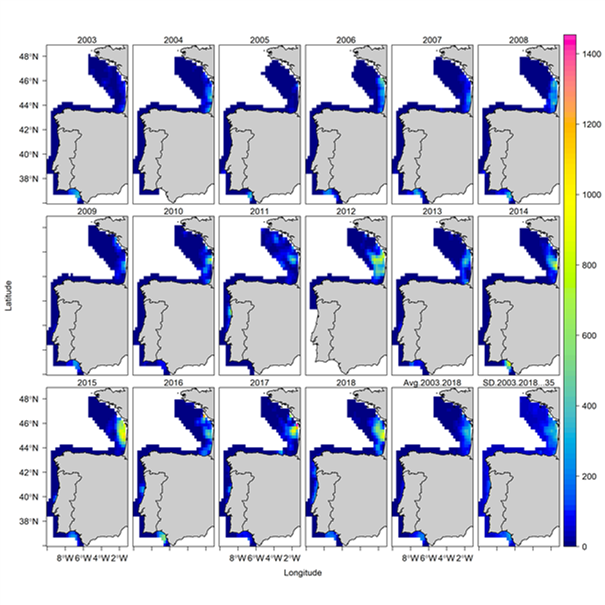
Maps of the springtime distribution of European anchovy derived from the WGACEGG long term (2003–2018) data series (acoustic densities in 15km square grids). The European Atlantic area has been covered for most years, except in 2012 in the Southern part, due to technical issues with the sampling platform.
Discover the Working Group on Acoustic and Egg Surveys for Sardine and Anchovy.
Baltic International Fish Survey Working Group (WGBIFS)
The
Baltic International Trawl Surveys (BITS) monitor the spatial distribution and year-class abundance of cod, flounder, and other flatfish, and to some extent even clupeids in the Baltic Sea. Eight Baltic Sea nations participate in carrying out the BITS surveys.
The first fish trawl surveys in the Baltic Sea that evaluated the recruitment and spatial distribution of cod were carried out by Poland in 1962. Most Baltic countries developed their own national trawl surveys during the subsequent years. However, it was difficult to combine the results because of the variation in fishing gears, the realization of fishing hauls, and the survey periods. The first attempt to coordinate the national trawl surveys in the Baltic was made in 1985, followed by several attempts to determine the conversion factors between different fishing gears.
Internationally coordinated trawl surveys in the Baltic Sea were finally established in 1996 when the first meeting of the
Baltic International Fish Survey Working Group (WGBIFS) took place. During that meeting, the design of the bottom trawl surveys was considered and the development of a common survey manual was initiated. In 1998, an EU study project provided funding for the development of new standard fishing gears. In 1999, and successive years, intercalibration experiments between national and new standard gear were conducted to estimate conversion factors between the fishing efficiency of these gears.
In 2001, a new stratified random sampling design was adopted for BITS and besides the traditional quarter 1 survey, an additional BITS survey was initiated in quarter 4. The Tow-Database was also established in 2001: it contains a list of geographical positions where fishing-stations can be realized without any natural difficulties. It is updated annually based on feedback from surveys. Since 2009, all BITS data are uploaded into ICES
DATRAS (Database of Trawl Surveys) to support the Baltic ecosystem analyses.
At the beginning of 2010s, the Russian Federation withdrew participation in several surveys which undermined the full coverage of the survey area. The Chair of WGBIFS contacted ICES Secretariat to ask for assistance to address the problem. A request from ICES General Secretary to the Russian ICES delegates helped to solve the problem for several years.
Typical distribution of BITS haul stations.
Discover the Baltic International Fish Survey Working Group.
Working Group on International Deep Pelagic Ecosystem Surveys (WGIDEEPS)
WGIDEEPS plans and reports on the international hydroacoustic-trawl surveys on
pelagic beaked redfish (Sebastes mentella) in the Irminger and Norwegian Seas. The aim is to provide sound, peer-reviewed, and integrated scientific advice on fishery management. The surveys are the primary basis for advice on the stock status of pelagic redfish in these areas. In addition to stock assessment, survey results are necessary for mapping the vertical and horizontal distribution of pelagic beaked redfish, collecting biological data on other fauna, and monitoring environmental conditions.
Monitoring pelagic beaked redfish is challenging. The key difficulties include the basin-wide geographical distribution (>650 000 NM2), seasonal and ontogenetic large scale migrations, the occupation of demersal and benthic habitats at different stages of the life cycle, a deep distribution (100–950 m) which imply remote access to hydroacoustic devices, and generally poor knowledge of pelagic beaked redfish interactions with the pelagic ecosystems of the Irminger and Norwegian Seas.
Surveys have been conducted on pelagic beaked redfish in the open Irminger Sea since 1983 and the Norwegian Sea since 2007 to address these challenging issues, but mainly to collect biomass estimates for stock assessment purposes. In addition to stock assessment, the results from the surveys are necessary to map the vertical and horizontal distribution of pelagic beaked redfish, to collect biological data on other fauna, and to monitor the environmental conditions in the areas. These surveys have been conducted by individual nations or in collaboration between nations. The area coverage and methodology have varied, however, with area coverage often limited in the early years. The surveys are mainly hydroacoustic, but pelagic trawling has also been used since 1999.
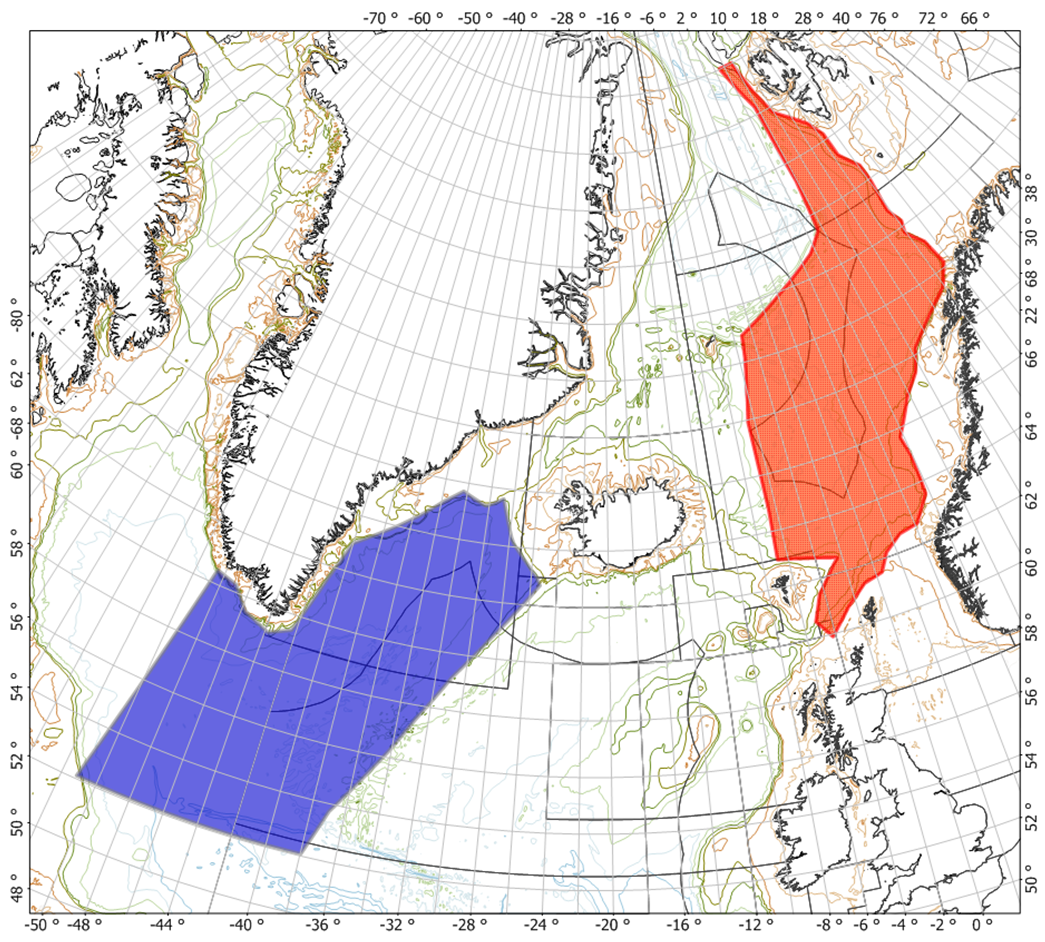
Area covered by the surveys on deep pelagic redfish (S. mentella) in the Irminger Sea (blue area) and the Norwegian Sea (red area).
Discover the Working Group on International Deep Pelagic Ecosystem Surveys.
Working Group of International Pelagic Surveys (WGIPS)
WGIPS coordinates, implements, and reports on acoustic surveys for
pelagic fish species in ICES areas 1–8 and subareas 21–24. WGIPS currently covers four internationally coordinated and nine national surveys. These surveys provide indexes for the assessment of pelagic fish stocks in the North East Atlantic.
Echolocation as a fisheries survey tool is in constant development and therefore methods are continually evolving. Improvements invariably lead to the collection of more precise data, improving the quality of surveys and reducing uncertainty. The assignment of acoustic values to species is addressed annually during WGIPS meetings and in dedicated scrutiny workshops in order to ensure consistency. Good biological sampling is required during acoustic surveys and the quality of sampling and methods used in ageing and maturity determination are continually monitored by WGIPS workshops and communication with other ICES expert groups.
Beginning in 1991, herring in the North Sea (HERAS) is the oldest coordinated survey and has evolved from national participants providing data independently from individual databases to currently collating biological and acoustic data in a database hosted by ICES. The other three internationally coordinated surveys, the International Ecosystem Survey in the Nordic Sea (IESNS, 1997–present), the International Blue Whiting Spawning stock Survey (IBWSS, 2004–present) and the International Ecosystem Summer Survey in the Nordic Sea (IESSNS, 2007–present) provide data to the Planning Group on Northeast Atlantic Pelagic Ecosystem Surveys database (PGNAPES). The intention is to migrate all survey data to the ICES database in the near future.
Since 2016, most WGIPS surveys have used the R-based open-access software (StoX) to calculate global abundance estimates from both internationally coordinated and national surveys at joint post cruise meetings in liaison with WGIPS. The intention is to use StoX as the tool to estimate abundance and biomass for all surveys coordinated by WGIPS. Using both the ICES database and StoX improves transparency and harmonizes survey methods across all surveys.
This general development from national to international based data collection means transfer of some sovereignty from the scientists involved. WGIPS surveys are moving towards greater harmony and transparency across all surveys. The key for success in maintaining long term data sets for these surveys lies in the ongoing cooperation that occurs during WGIPS meetings and in particular post cruise meetings which take place shortly after each of the surveys.
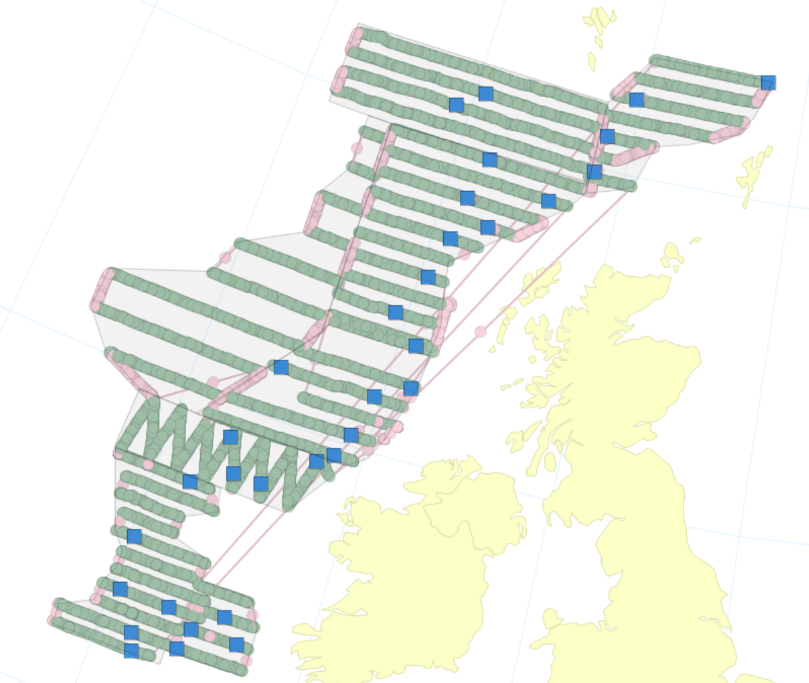
The internationally coordinated blue whiting spawning acoustic survey in 2019 visualized in the StoX software. Scrutinised transects are shown by the green dots and valid hauls of blue whiting are represented by the blue squares.
Discover the Working Group of International Pelagic Surveys.
Working Group on Commercial Catches (WGCATCH)
Landings and effort data are often generated in a census approach but for some countries and/or fleets, sampling approaches are necessary to assess the quality of declarative data.
Biological data and discard data are generally generated by sampling schemes (e.g. on-shore, off-shore programmes, self-sampling, reference fleets). In an ideal world, the data would be reliable, unbiased and precise as these data are often treated as exact in fish stock assessments. However, they have variable quality (e.g., reported landings may be inaccurate to varying extents over time) and the estimated data derived from sampling schemes (discards and biological data) may be biased due to sampling and estimation techniques.
Data from fisheries often form the primary basis for reconstructing historical populations and estimating fishing mortality and is vital the end-users to have confidence in the fishery data underpinning stock assessments and advice on sustainable fishing. Detailed fisheries information, collected specifically for the purpose of determining fish stock biomass, tends to exist only for recent decades. For most quota species, stock assessments are effectuated since the 1970s, and in some cases since the 1950s.
WGCATCH was created following a series of ICES workshops and planning groups with the main objective of assuring the quality of catch data to be used in the stock assessments. The group do not maintain any of these time-series but develop guidelines for improving the design, practical implementation, and documentation of catch sampling programs, and the following estimation. WGCATCH is also involved in providing advice to the development of the
Regional DataBase (RDB) and the regional database and estimation system (RDBES) to support design-based data collection and the following estimation.
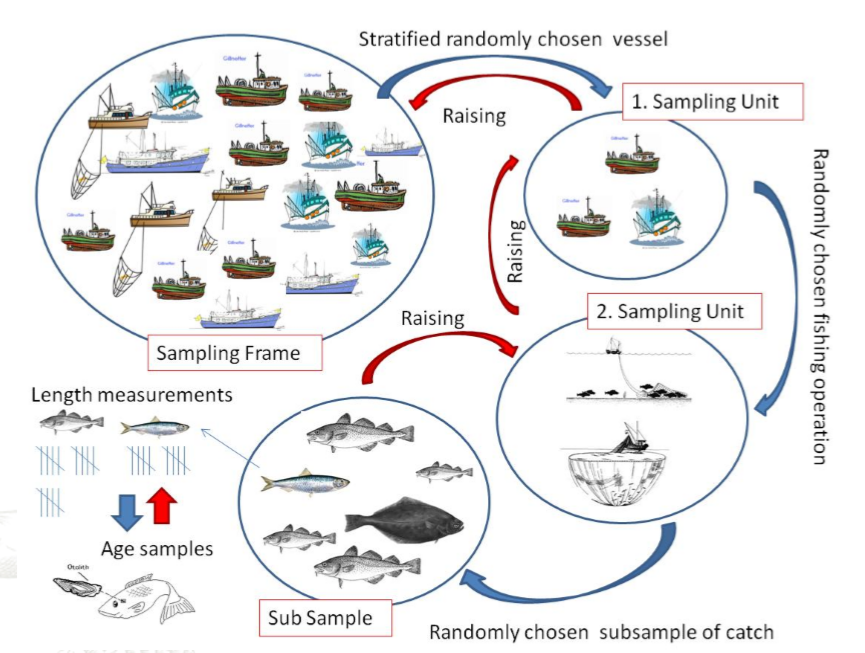
Over the last years, statistically sound catch sampling programmes have been implemented across countries to improve the accuracy (bias and precision) of data collected. This is an illustration of an example of stratified random sampling programme (Vølstadand Armstrong, 2014).
Discover the Working Group on Commercial Catches.


