There is evidence of temporal trends in surface water temperatures and salinities throughout the ecoregion. A long-term warming trend (since the 1980s) increased sea surface temperatures by 1–2°C across the ecoregion. Decadal-scale regional oceanographic oscillations are superimposed on this, causing regional differences or offsets to the trend. Since 2007, the surface waters of the northern part of the ecoregion have been warming, while those in the southern subregion have been cooling (Figure 9).
Surface salinity over the Northeast Greenland Shelf has decreased by 1.8 g kg−1 since the early 2000s. Since 1980, the Southeast Greenland Shelf and deep waters in the northern subregion have experienced an increase in surface salinity of up to 0.2 g kg−1 decade−1 (Figure 10).
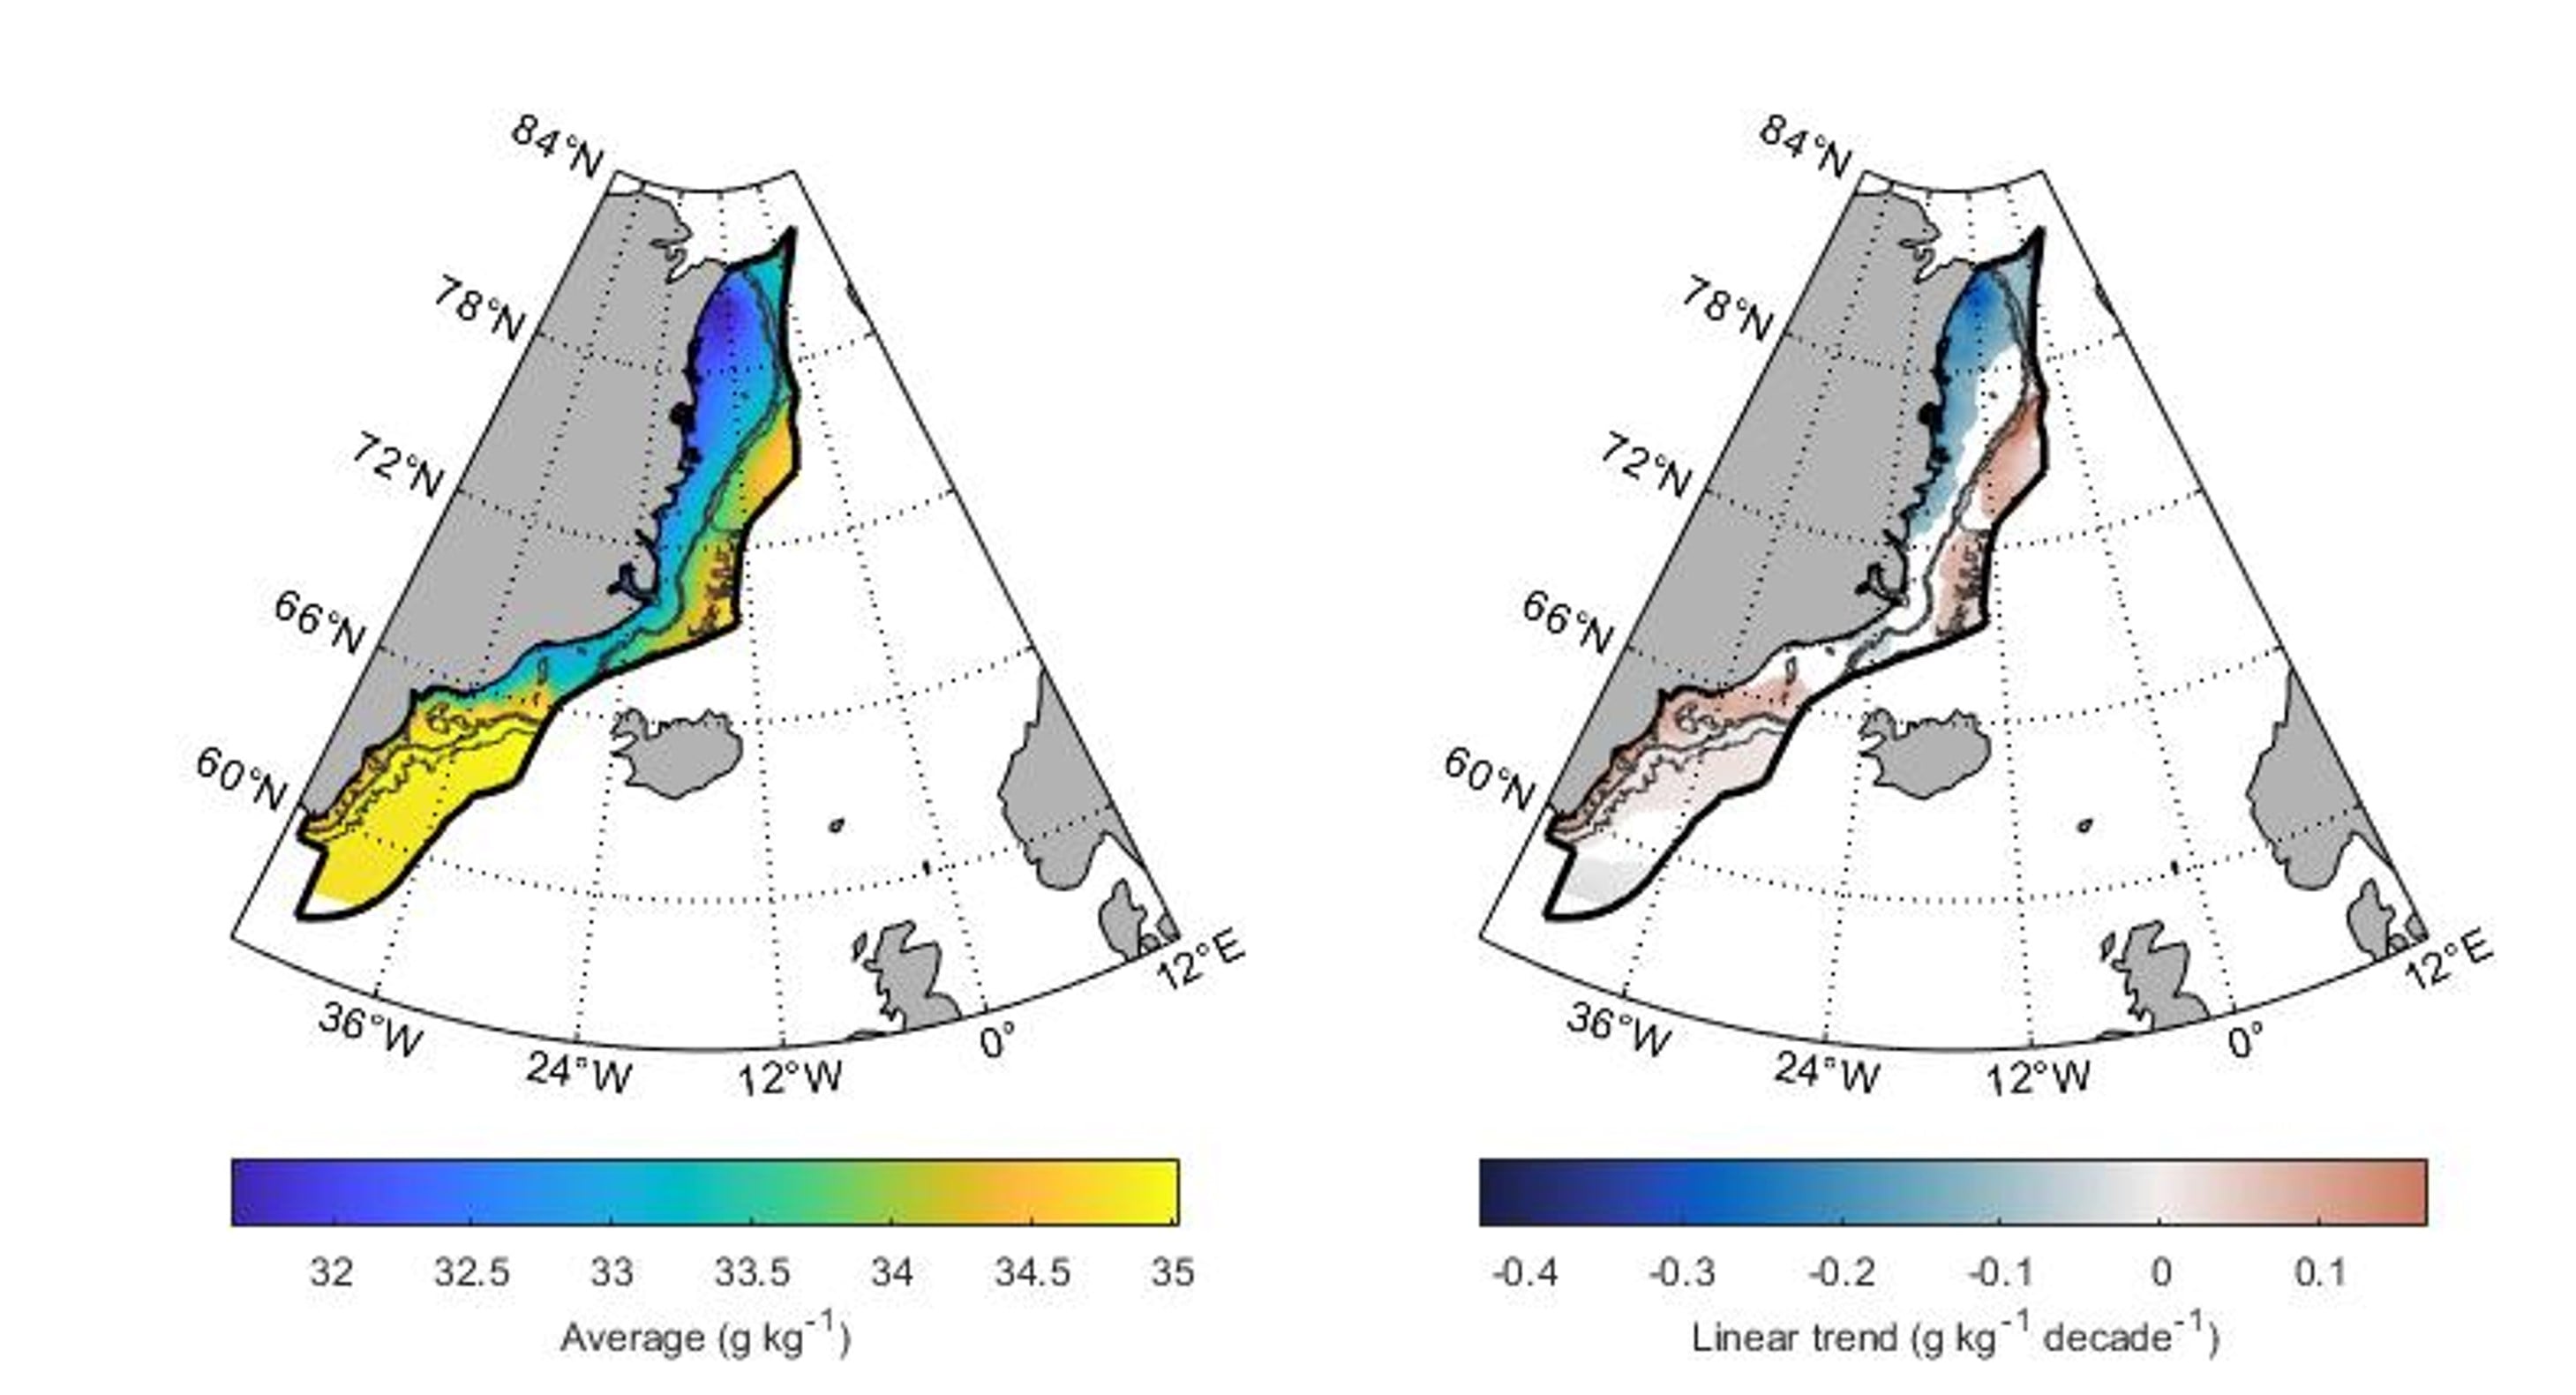
Figure 10: Average (left) and linear trend (right) in sea surface salinity calculated over 1980-2020. Only significant linear trends are shown. Based on data from Ocean Reanalysis System 5 (ORAS5): https://cds.climate.copernicus.eu/cdsapp#!/dataset/reanalysis-oras5?tab=overview
Changes in surface water stratification (0–100 m) have mainly been in response to changes in salinity across the ecoregion. On the Northeast Greenland Shelf, the reduction in salinity has resulted in an increase in stratification. The Southeast Greenland Shelf and the deep waters in the northern subregion, meanwhile, have experienced a weakening in stratification due to increasing surface salinity. The interaction between salinity and temperature has delayed the timing of the maximum in stratification up to two months on the Southeast Greenland Shelf and shifted it a month earlier in the deep waters in the northern subregion (relative to 1980–2000 baseline condition).
Sea ice coverage has declined over the past decades in the Greenland Sea ecoregion and adjacent areas (Figure 11). The summer sea ice minimum reflects the export of sea ice from the Arctic Ocean, while the winter sea ice has a contribution of locally formed sea ice. There has been a decrease in winter maximum sea ice extent since 1979 (the start of satellite records) and a small decline in summer minimum ice extent since 2006 (Figure 11). Both the summer and winter sea ice minima have occurred in the last decade.
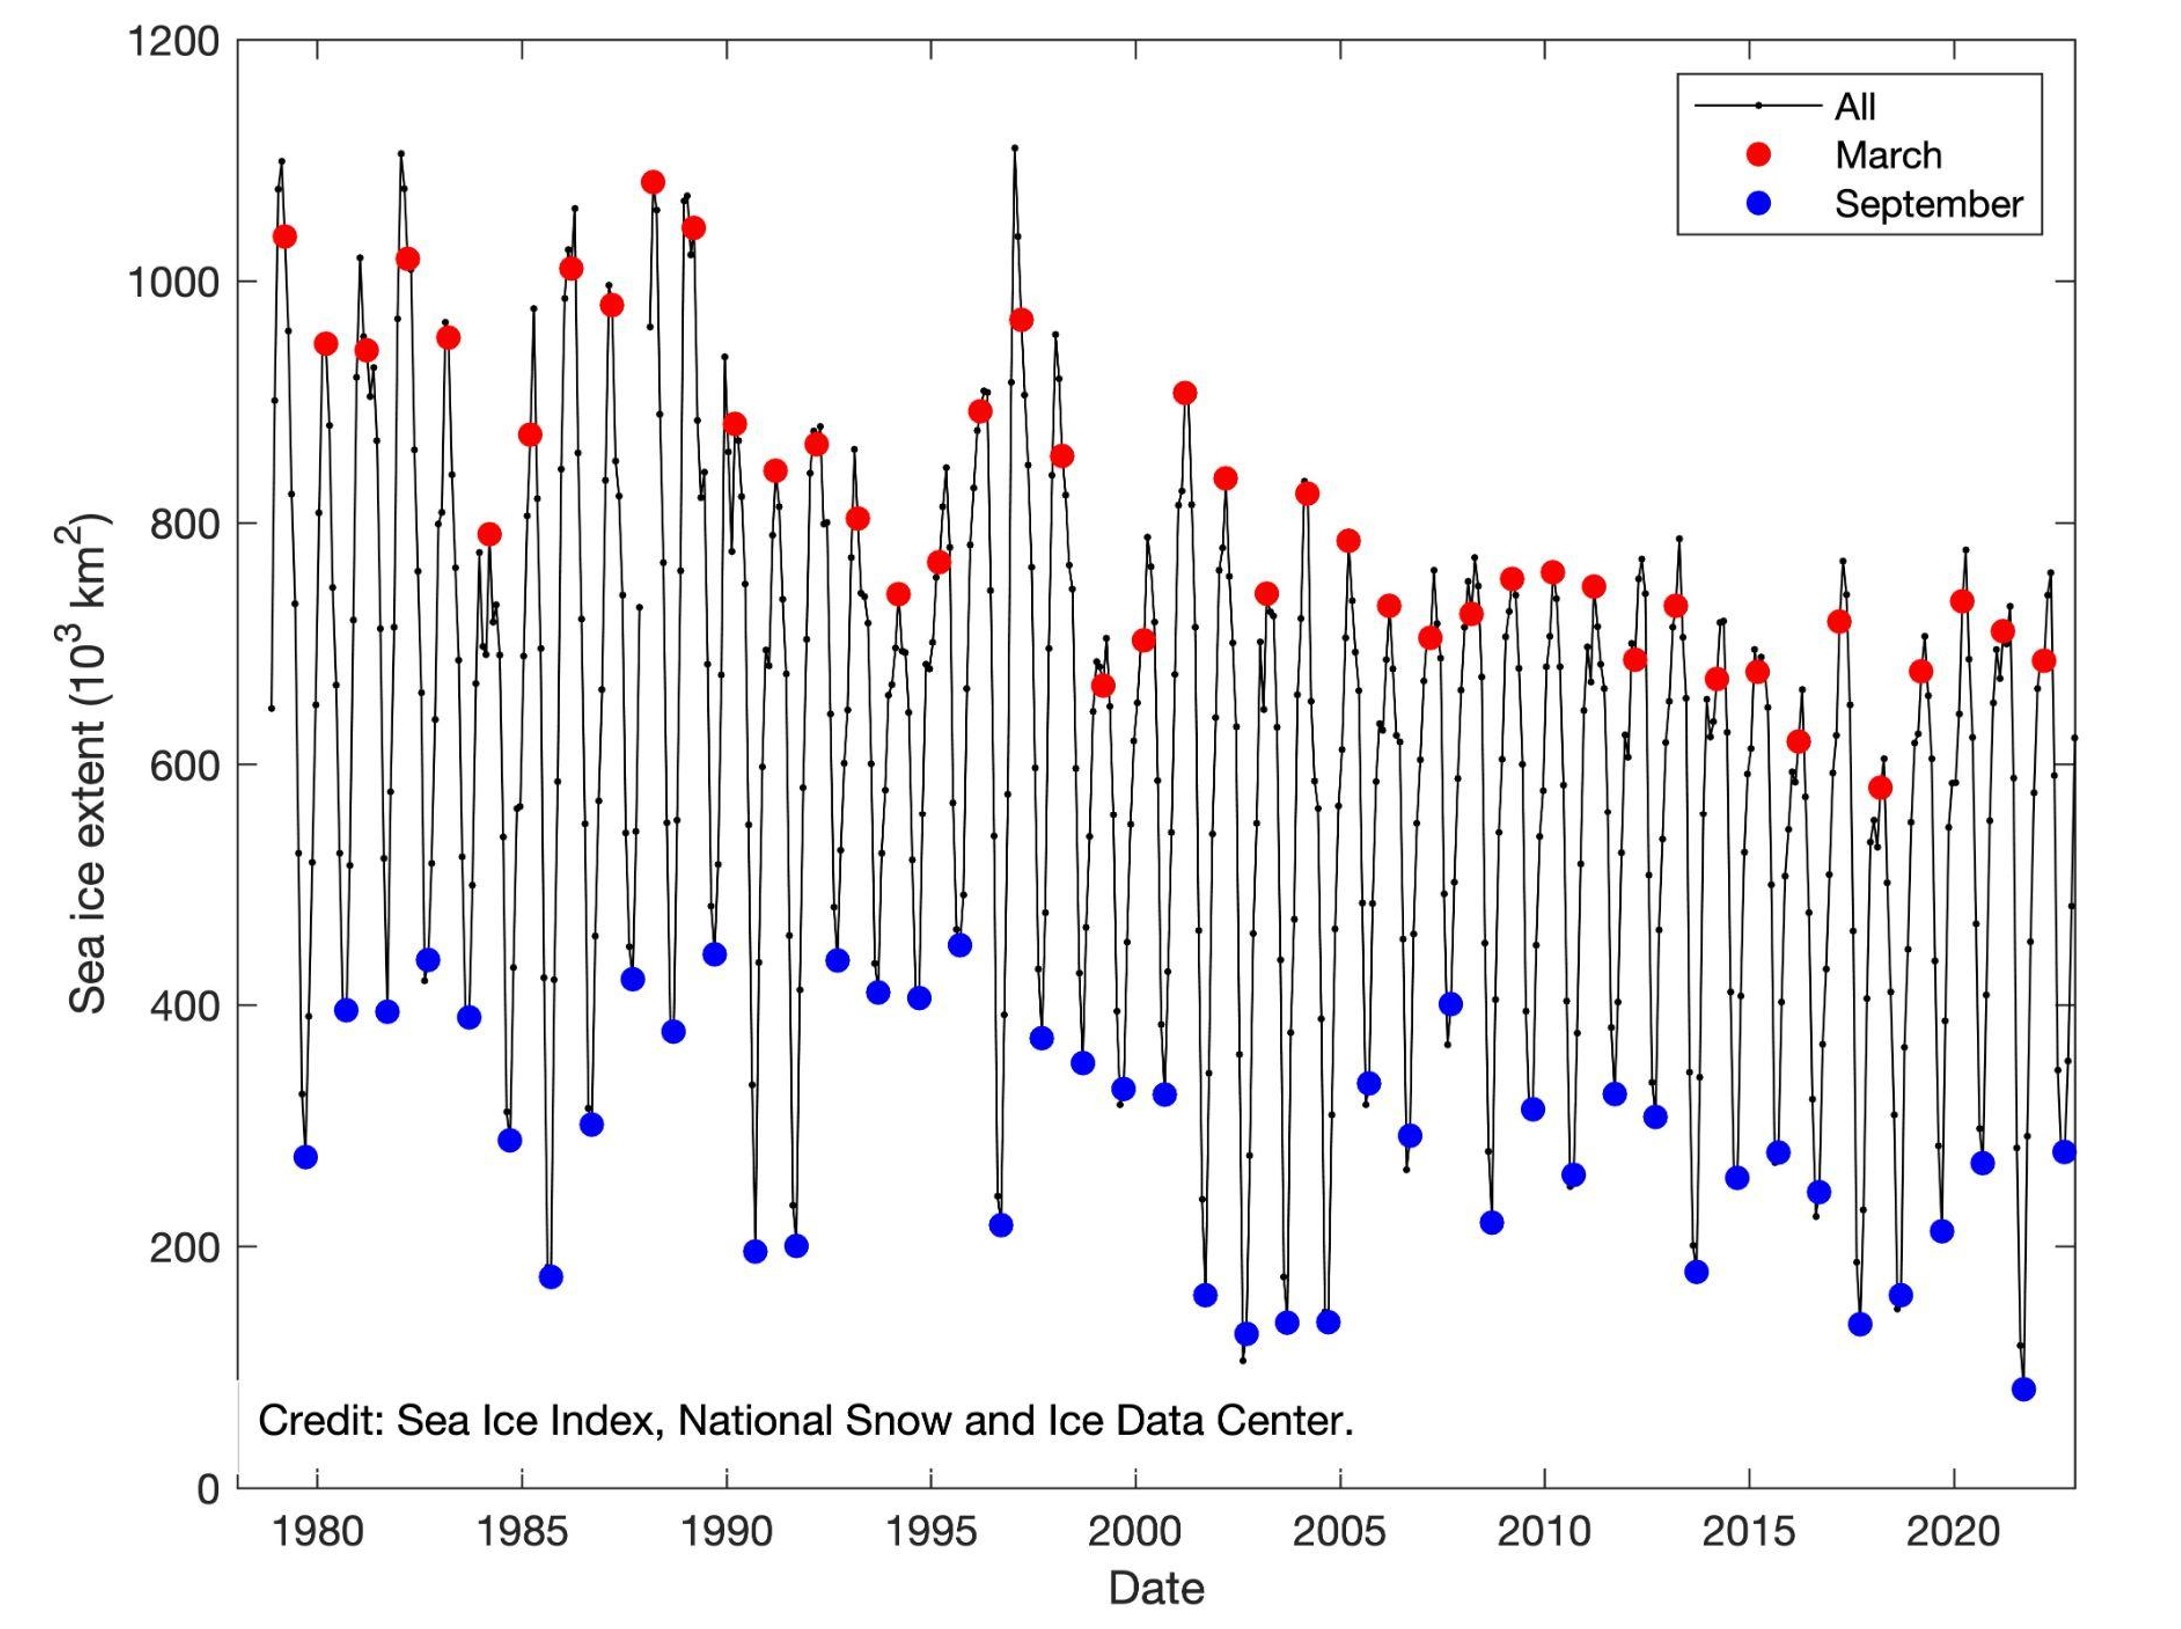
Figure 11: Monthly average of the sea ice extent for the area covering the Greenland Sea, Icelandic Waters, and the Norwegian Sea (western part) ecoregions.
It is likely that the changes in ice cover and stratification will induce changes in primary production due to their influence on light and nutrient availability.
A seasonal occurrence, observed in the 2010s, of bluefin tuna in the ecoregion is associated with warming sea surface temperatures in the southern subregion and the consequent migration of Atlantic mackerel to the area, increasing prey availability.
There has been a persistent westward shift in capelin distribution since the 2000s, from the Icelandic Waters and Norwegian Sea ecoregions to the Greenland Sea ecoregion. In addition, most of the nursery grounds for juvenile capelin have also moved to the southern subregion, and the summer feeding grounds for adult capelin are now mainly in the northern subregion. These changes are associated with the regional climate-induced changes.
Several boreal species, such as Atlantic cod, beaked redfish, and deep-sea shrimp, recently found on the Northeast Greenland shelf, could originate from the Barents Sea. These changes are thought to be a response to large-scale ocean climate changes resulting from global warming.
The increasing occurrence of humpback whales on the East Greenland shelf has been linked to climate-induced retreating sea ice and an increase of cold-water capelin, known to be an important prey species.
There is evidence of northward shifts in some breeding populations of seabirds in East Greenland in recent decades, including the immigration of at least two bird species, great cormorant (Phalacrocorax carbo) and lesser black-backed gull (Larus fuscus), to the southeastern part of the ecoregion. Also, the breeding areas of common eider have expanded more than 200 km northwards recently.


