Primary production
Phytoplankton production on the Faroe Shelf is controlled by atmospheric and oceanographic processes, including nutrient enrichment both locally and from the Subpolar Gyre. There are currently 92 taxonomic units (58 species, 34 genera) of phytoplankton registered (2018–2020) on the Faroe Shelf.
The Faroe Shelf (0–300 m isobath) has been divided into three distinct regions based on the chlorophyll phenology (Figure 9b): the Central Shelf, the Eastern Banks, and Outer Shelf (including the Western Region) with a tidal front separating the Central Shelf from the outer areas. The highest phytoplankton productivity is usually found in the Western Region (Figure 9b). The Faroe Shelf primary production has cascading effects on higher trophic levels in the ecosystem (figures 10d–g, grey bars). No trend in phytoplankton production is observed during the period 1990–2022 (Figure 10d).
In-situ measurements of chlorophyll a on the Central Shelf (1997–2022; 'St. S' in Figure 9b) show that bloom initiation (> 1 mg chl m−3) typically occurs in April–May reaching its peak in June (1.4 to 14.1 mg chl m−3). Bloom magnitude is tightly correlated with seasonal nitrate drawdown, although termination of strong blooms appears to be linked to silicate limitation. Blooms are typically dominated by chain forming diatoms such as Chaetoceros spp., Guinardia spp., Rhizosolenia spp., and Pseudo-nitzschia spp., transitioning to dinoflagellate communities following the onset of silicate limitation.
A declining trend in silicate winter concentrations has been observed in the Subpolar Gyre region which could influence the primary production in the waters of the Faroe Shelf.
Zooplankton
The zooplankton species composition on the Faroe Shelf is a mixture of neritic copepods (mainly Acartia spp. and Temora longicornis), as well as oceanic species that originally are advected onto the shelf from the off-shelf water mass (mainly the copepod Calanus finmarchicus) and meroplanktonic larvae from benthic fauna on the shelf. The zooplankton outside the tidal front is dominated by C. finmarchicus. The seasonal fluctuations follow those of phytoplankton, and the copepod egg production rates are clearly dependent on phytoplankton abundance. Thus, there is a clear bottom-up effect from phytoplankton to zooplankton in spring. In summer there is a temporal negative relationship between zooplankton and fish larvae and pelagic juveniles, indicating a top-down effect (figures 10e and 10f). The June zooplankton density is usually higher in the surrounding ocean than on the shelf (Figure 10e). The abundance of larger zooplankton like krill is not well known, since they escape the plankton nets.
Production of C. finmarchicus eggs declined throughout the Faroe shelf during the period 1997–2020. The reason behind the decline could not be explained.
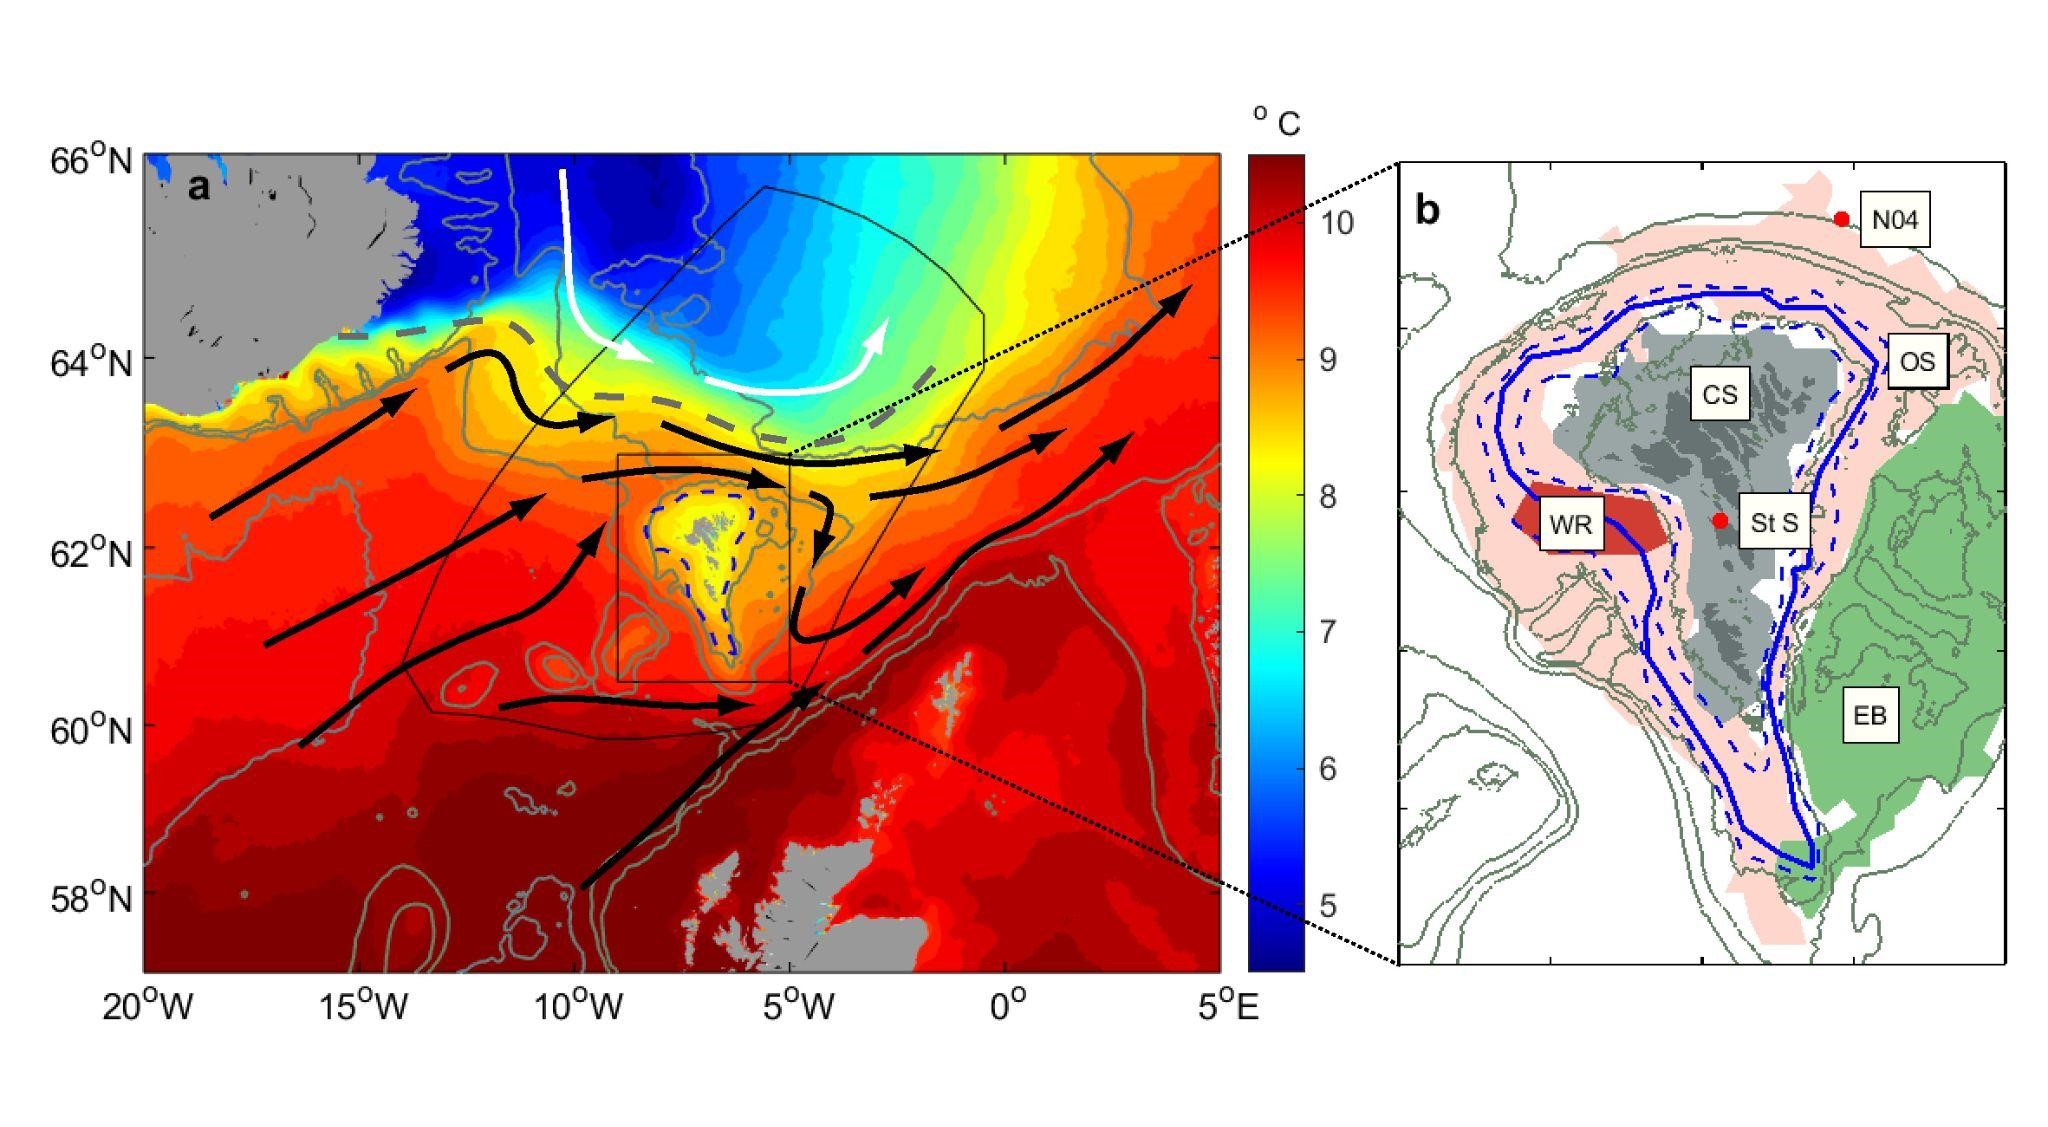
Figure 9: a: large-scale upper layer circulation in and around the Faroes ecoregion (arrows). Thick dashed grey line indicates the Iceland–Faroe Front, while the dashed blue line indicates the Faroe Shelf Front. The Faroes ecoregion is shown with a thin black solid line, while the outline of the map shown in panel b is also indicated with a thin solid black line. The colours indicate average sea surface temperature (SST) based on remotely sensed monthly SST maps in the period 2003–2020 (NASA Goddard Space Flight Center, Ocean Ecology Laboratory, Ocean Biology Processing Group) with 200 m, 500 m, and 2 000 m depth contours shown in grey. b: topography of the Faroe Shelf. The shelf front region is indicated by blue lines; primary production phenological ecoregions are indicated by coloured areas. The abbreviations are as follows: Central Shelf (CS), Western Region (WR), Outer Shelf (OS) and Eastern Banks (EB). ‘N04’ and ‘St. S’ indicate stations referred to in the text. 100 m, 200 m, 300 m, and 500 m depth contours are shown in grey.


