Around 230 fish species have been recorded in the Baltic Sea (including the Kattegat and the Sound), of which 90 reproduce regularly in the Baltic Sea and the Sound. Thirty to forty freshwater fish species occur in the inner Baltic Sea and coastal areas.
The composition and diversity of the open-sea fish community is structured along the salinity gradient, with a higher diversity in the west compared to the east and north. Up to 80% of the biomass in the open-sea fish communities is shared between three species: cod, herring, and sprat. In the late 1980s and early 1990s the regime shift in the open-sea pelagic ecosystem was evident by a shift from a cod-dominated system to one dominated by sprat and herring. Trends in fishing pressure are presented in the “Selective extraction of species" section.
For most of the pelagic stocks in the Baltic Sea, the spawning-stock biomass has increased since 2000 and is now above, or close to the biomass reference points used in stock assessments. An exception is the western Baltic cod stock, for which the biomass is below Blim (Figure 17).
The SSB of western Baltic cod has been below the limit reference point (Blim) since 2008, which has also led to a reduced reproductive capacity. However, because of one strong year class in 2016 an increase is seen in later years. The eastern Baltic cod stock is decreasing, and the stock size in 2018 is the lowest observed in the time-series (since 2003). The SSB is below Btrigger, although the stock status is uncertain due to lack of analytical assessment and problems with age reading. The eastern Baltic cod population structure has deteriorated in recent years and shows no improvement. Since 2017, the biomass based on the two latest surveys shows a decline in most length groups, with the decrease being especially strong for the biomass of eastern Baltic cod in length classes above 40 cm. The declining eastern Baltic cod condition (Figure 18) has been linked to limited food availability as well as hypoxia and selective fishing pressure.
 F
F
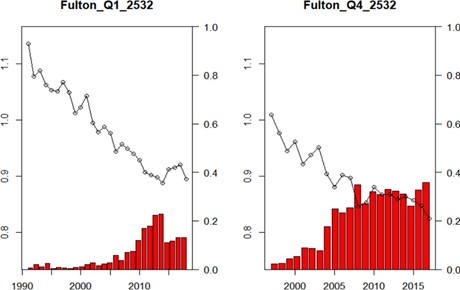
Figure 18: Eastern Baltic cod average condition (Fulton K) for
the 40–60 cm length group in the Q1 and Q4 BITS survey in subdivisions 25–32.
The lines show mean values for Fulton K, the bars show the proportion of cod at
Fulton K < 0.8. A Fulton K value below 0.8 is assumed to indicate
starvation.
Coastal fish communities (waters < 20 meters deep) often show a greater species diversity than open-sea fish communities, due to the addition of freshwater species (perch, pikeperch, pike, whitefish, and cyprinids) and the introduced round goby Neogobius melanostomus. The coastal communities have a more local population structure and response to environmental signals. Changes in the species composition of coastal fish communities in past decades are linked to an increasing water temperature and decreasing salinity. In many areas, the increasing trend in the abundance of cyprinids and a concurrent decrease in piscivorous fish indicate a deteriorating ecosystem status, although this trend has shown some signs of improvement in more recent years. Increased levels of nutrients favour cyprinids and pikeperch. The abundance of the three-spined stickleback Gasterosteus aculeatus, an important species for the coastal ecosystem functioning and a resource competitor with other pelagic fishes, has increased in the past decade. Flounders are key benthic fishes in the central and southern Baltic Sea, particularly in coastal areas.
Salmon and sea trout are fished in coastal and open waters of the Baltic Sea. The harvest rate of salmon has decreased considerably since the beginning of the 1990s. Since 1997, total wild smolt production has increased tenfold in the Bothnian Bay. This area is the largest contributor to the overall smolt production in the Baltic Sea. Despite the overall increase in wild smolt production, there was a decline in post-smolt survival from the late 1980s until the mid-2000s.


